
Description
The project Smart Urban Heatmap Bern provides current and historical measurements of air temperature and relative humidity at over 100 measuring stations throughout the city and region of Bern. Measurements are taken every 10 min. The data of the Smart Urban Heat Map Bern measurement network can be queried in a machine-readable way via a REST API. This provides access to the most recent measurements, station metadata, and user-defined time series. To reduce the potential temperature bias when stations are exposed to direct sunlight, all stations are ventilated before measuring. However, in some cases, especially during the day, measured temperatures might still be slightly higher than actual temperatures.
Resources
Showcases
-
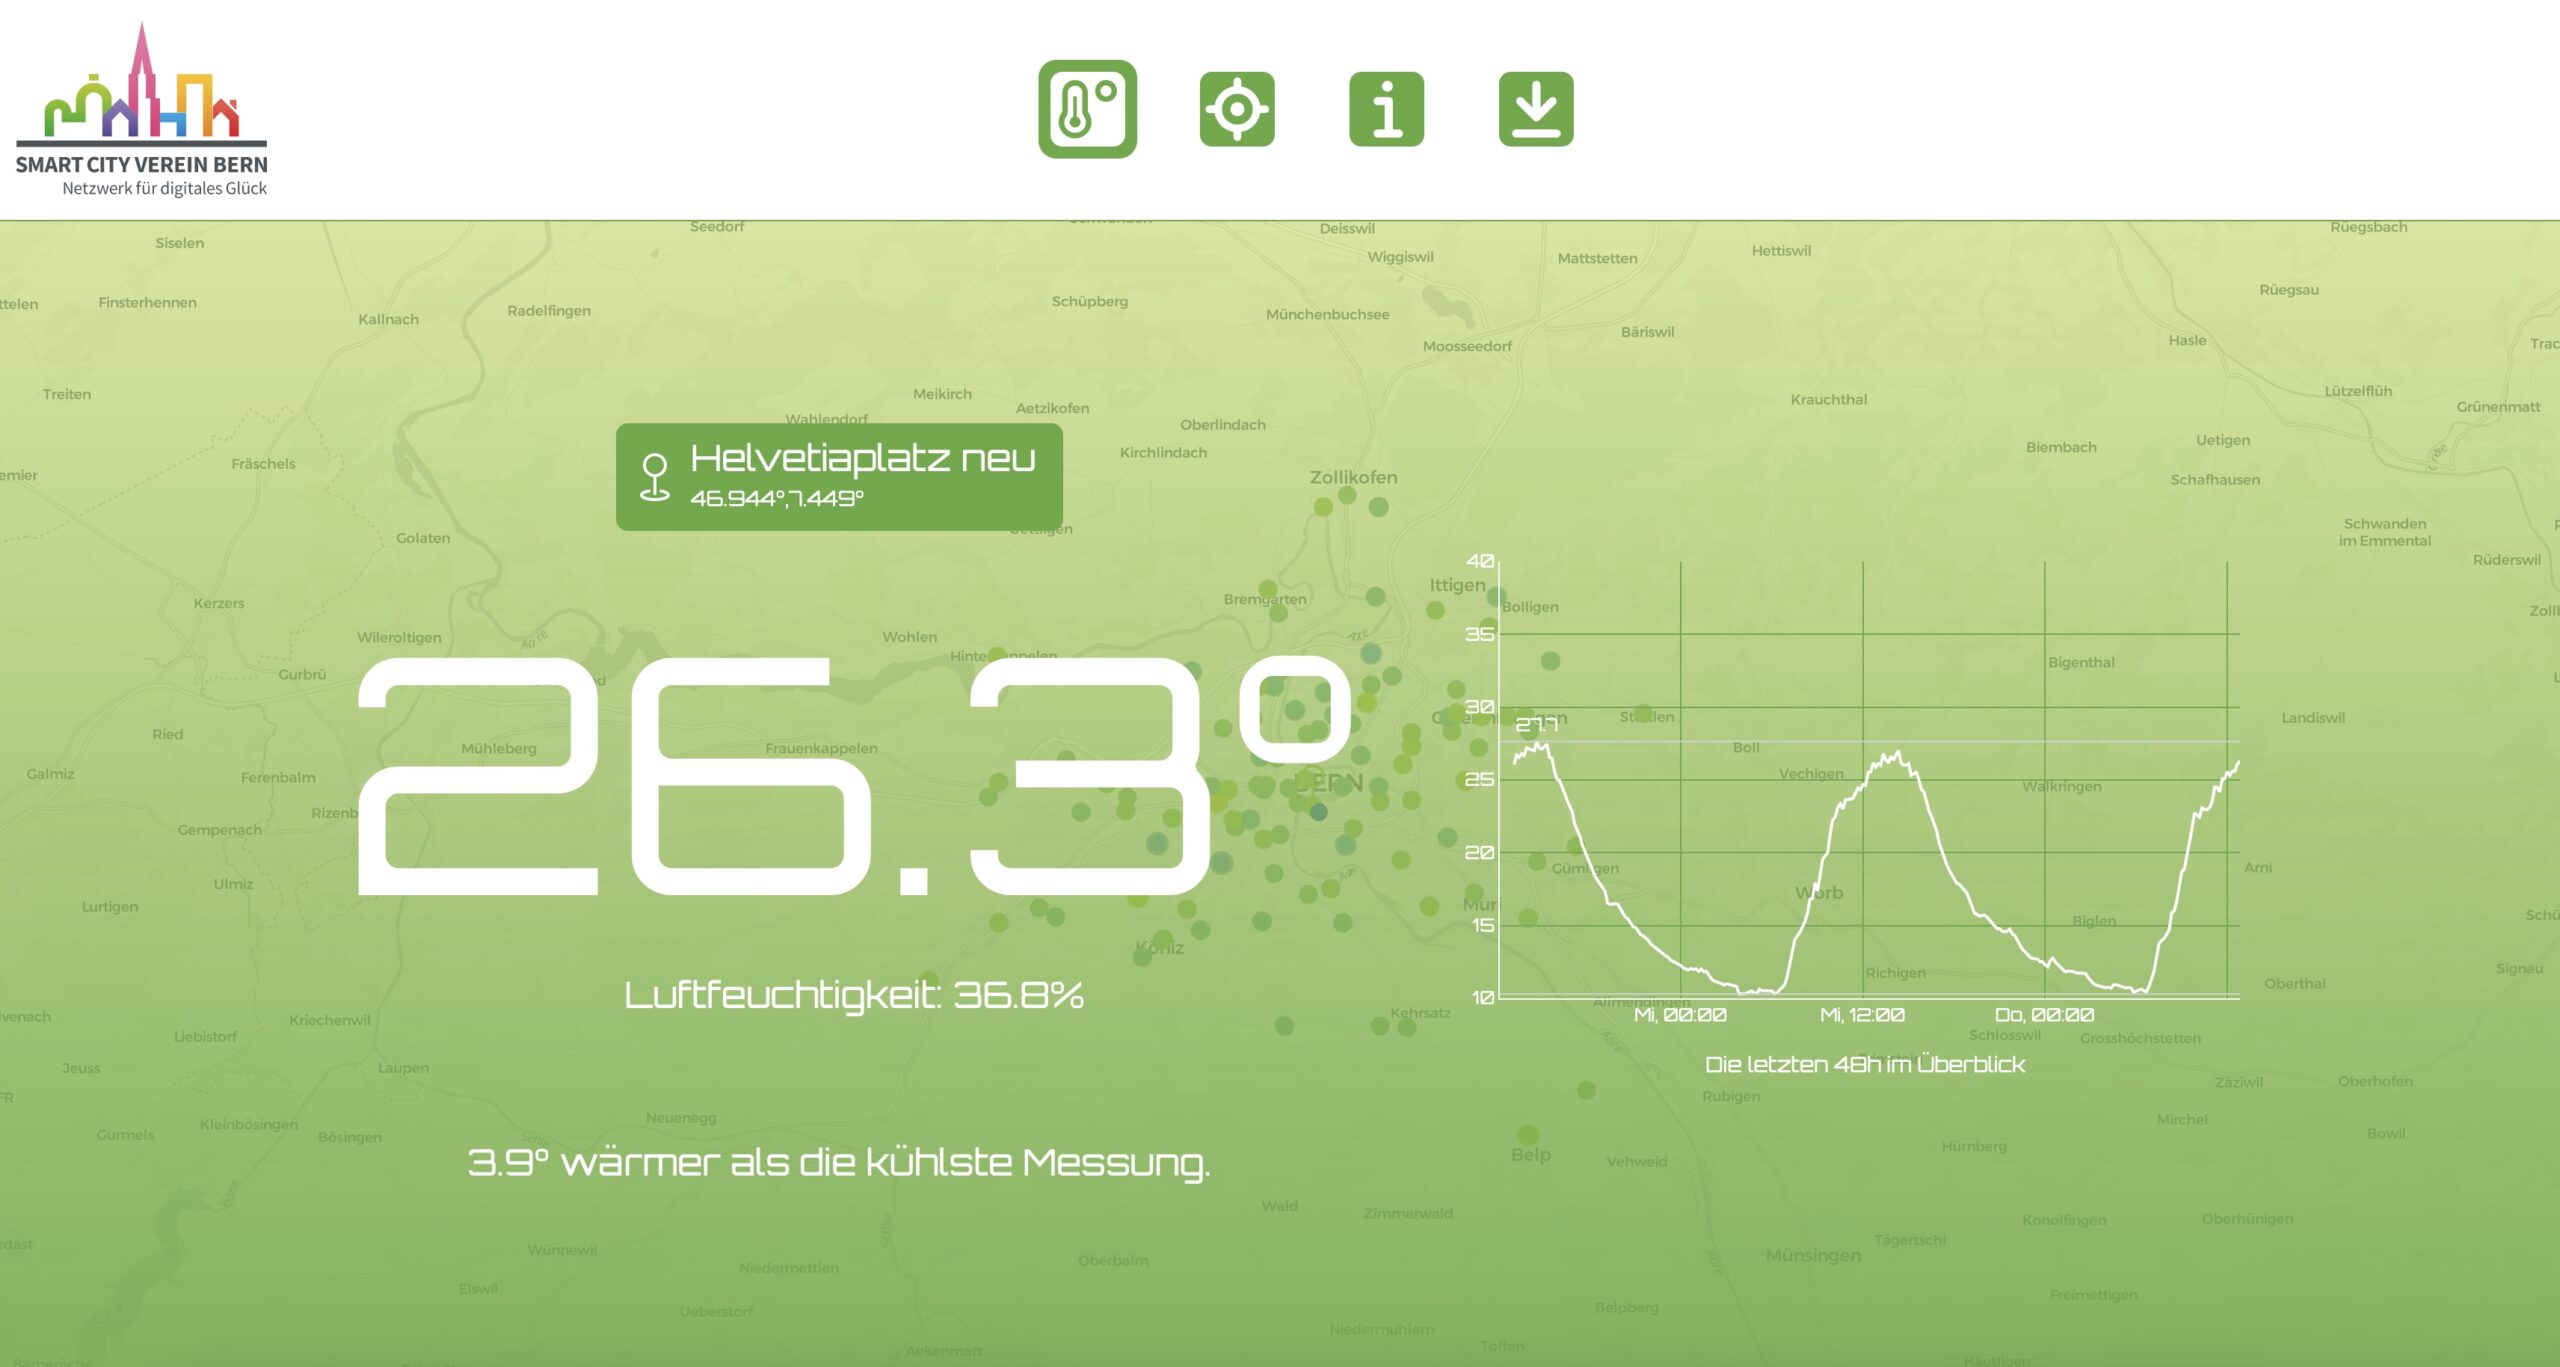
Smart Urban Heatmap Bern
Die Smart Urban Heat Map ist eine Initiative des Smart City Vereins Bern zur Visualisierung der urbanen Hitze in Stadt und Region Bern. Live Temperatur Messwerte von über 100...1 Dataset Smart Urban Heatmap Bern
Additional information
- Identifier
- aee1016a-212f-4576-be07-9b0f774ac08e@public-sector-transformation
- Issued date
- October 9, 2023
- Modified date
- -
- Conforms to
- -
- Publisher
- Institute Public Sector Transformation of the Bern University of Applied Sciences
- Contact points
- stephan.haller@bfh.ch
- Languages
- Language independent
- Further information
- geocat.ch permalink
- Landing page
- https://meteotest.github.io/urban-heat-API-docs
- Documentation
- Temporal coverage
- -
- Spatial coverage
- Bern
- Update interval
- -
- Metadata Access
- API (JSON) Download XML


